President's Corner - Donald DiPette

SMA President’s Message: January 2018

January 29, 2018 // Randy Glick

DONALD DIPETTE, MD, COLUMBIA, SOUTH CAROLINA
Dr. DiPette was installed as SMA’s 113th President during the 2nd General Session of SMA’s Medical Summit Conference, November 4, 2017 in St. Petersburg, Florida. His Presidential Address focused on key elements of the Association’s mission statement … quality, patient care, and education.

Dr. DiPette’s Message:

I hope everyone in the Southern Medical Association family had a wonderful holiday and I wish all a very Happy New Year!  It is an honor to bring this first quarterly President’s Message of 2018 to you.  I am grateful to be entrusted with the leadership of our Association and thank all the members and staff who commented positively on the content of my President’s Inaugural Address.  This year is off to a running start, building on the planning and accomplishments of the last year.  There is a great deal of excitement, energy, and enthusiasm and multiple new initiatives and programs are underway.  This quarterly message will follow this year’s theme, “Addressing the Increased Disease Burden in the Southern Region”, as well as, the four areas for growth, namely, Relevance of our association, Collaboration with other organizations sharing similar and complementary missions and visions, Engaging academia and academic medical centers, and Develop and implement a youth strategy, which are detailed in the Presidential Address.  

Despite the hectic holiday season, our new committees are well underway. The Education Committee, under the leadership of Dr. Christopher Morris, has developed an overall agenda for the year and is actively meeting and planning our Annual Scientific Assembly to be held in the fall.  In addition, a new calendar of Web-based educational activities for the remainder of the year is being developed. The Membership Committee, chaired by Dr. Lee Carter, is actively seeking members and will meet in the near future. Although a seemingly “thankless” job, increasing membership is our life-line to the future.  I encourage all members to consider joining and supporting the committee.  The Health Policy Committee Chair position is currently vacant; if you are interested in either chairing this committee or serving on the Health Policy Committee or the Membership Committee, please contact Wendy Erhart at wendy@sma.org for more information. The Budget and Finance Committee, chaired by Dr. Gary Delaney, met during the Annual Meeting in November and will meet again this month. Thank you to all serving on these committees; your leadership, dedication, and commitment to the Association are invaluable.

To address this year’s theme of “Addressing the Increased Disease Burden in the Southern Region”, we have developed a partnership with Clinical Care Options to develop diabetes education programs in 10 cities across the South. The goal of this partnership is to improve participants’ clinical competence in preventing type 2 diabetes mellitus, and applying culturally competent treatment strategies in the management of patients with type 2 diabetes mellitus and associated cardiovascular risks.

To remain relevant in today’s healthcare environment, our Association must seek ways and methodologies targeted to increase the awareness and application of new technology which will enhance patient care in both the inpatient and outpatient settings.  We are pleased to share our collaboration with Dr. Michael Wagner, Assistant Professor of Internal Medicine and Director of the Internal Medicine Ultrasound Education program at the University of South Carolina School of Medicine in Columbia, S.C., in developing a hands-on course for the 2018 Women’s Health Conference that focuses on handheld/portable ultrasound technology in primary care. Dr. Wagner also is guest editing a series of articles for the Southern Medical Journal related to the clinical use of portable ultrasonography.

It is critical that the SMA develops relationships, partnerships, and collaborations with organizations sharing  similar and complementary missions and visions. We are pleased to announce that immediately following the 2018 Annual Scientific Assembly, the SMA will jointly sponsor with the Carolinas, Georgia & Florida Chapter of the American Society of Hypertension and the World Hypertension League, a one-day symposium focusing on hypertension, stroke, and cardiovascular disease. In addition, the SMA has served as the accrediting provider for the recent Society of Gynecologic Surgeons’ postgraduate course, as well as for the Society’s upcoming annual meeting.

Planning of this year’s Annual Meeting is underway, and to reach out and engage academia, we are currently developing a Deans’ Forum that will take place at the opening of the Assembly on October 31, 2018. Designed to include the deans or their designees from the four medical schools in South Carolina, the purpose of this panel discussion is twofold: to discuss academia’s collaborative role with associations such as SMA and to address the role academia plays in addressing the SMA’s theme, “Addressing the Increased Disease Burden in the Southern Region”.  In addition, the forum will provide an opportunity to highlight activities of the respective medical schools and their associated healthcare systems.

The SMA has a long, rich tradition of developing physician leaders in medicine.  This development must start very early in the future and present careers of our younger learners and physicians. In keeping with this “Youth Movement”, greater emphasis has been placed on expanding opportunities for Medical Students, Residents, and Fellows to be involved in our association.  Such opportunities include presenting to and becoming more involved in the annual assembly, and in the future, to ultimately lead SMA. The Annual Assembly this year will dedicate a day to young physician education and leadership. Tentative activities being planned include additional time for poster presentations and oral abstracts, as well as a roundtable luncheon with academic and association leadership. Information will be online soon -- please visit sma.org/assembly in the coming few weeks for the latest on topics and events!

As can be seen from the activities detailed above, this year is off to a running start!  It goes without saying,  this could not be accomplished without the participation of a dedicated membership and staff.

Again, I extend my heartfelt thanks; it is a privilege to serve as  your President. Please feel free to contact the SMA headquarters office or me with your ideas, thoughts, and comments. Together, we can achieve great things!

Sincerely,
Donald DiPette, MD, FACP, FAHA
SMA President, 2017-2018
Email: ddipette@sma.org

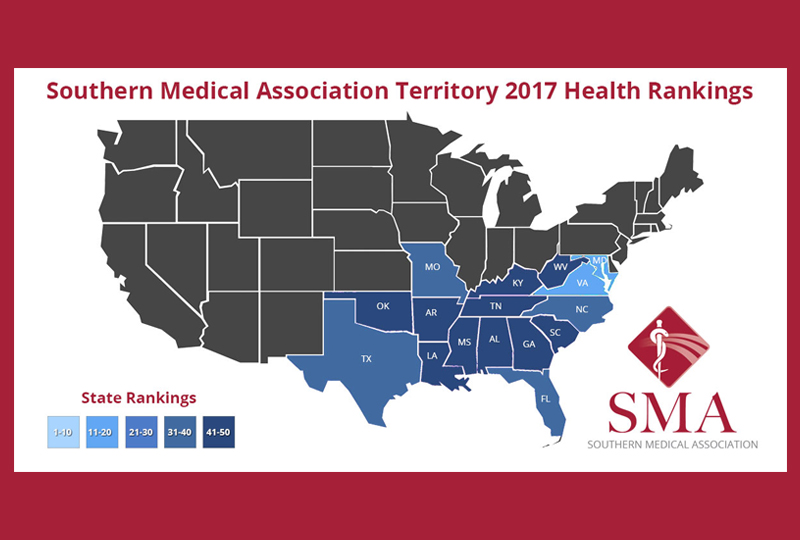
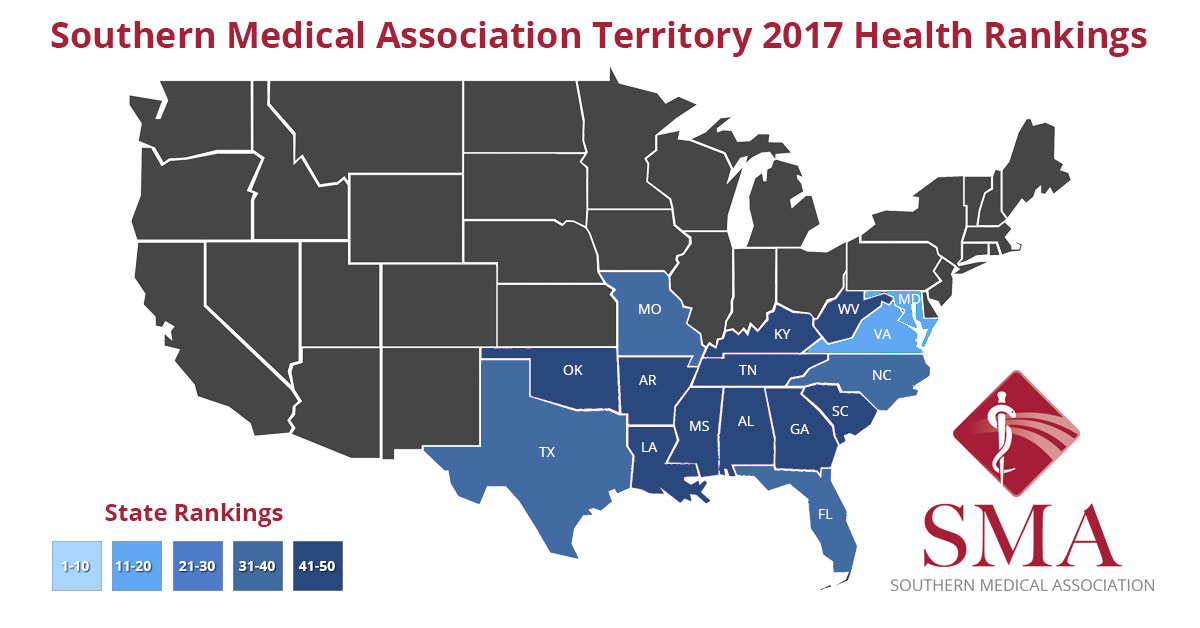
Health Rankings SMA Territory Map

Health Rankings in the South

January 18, 2018 // Randy Glick

For the past 28 years, the United Health Foundation has produced an annual report assessing the nation’s health on a state-by-state basis. The report is a great tool to measure progress, identify emerging trends, and drive action for improving public health.

The rankings have been broken down into four core measures which directly influence health outcomes:

  • Behaviors
  • Community & Environment
  • Policy
  • Clinical Care

Here we take a look at the states that fall within the territory of the Southern Medical Association.

Originally founded to address the needs of patients in the Southeastern United States( Alabama, Arkansas, Florida, Georgia, Kentucky, Louisiana, Maryland/DC, Mississippi, Missouri, North Carolina, Oklahoma, South Carolina, Tennessee, Texas, Virginia, West Virginia), SMA membership currently includes members from all 50 states and international members.

It should be quite obvious that we are in an area of great need, with the southern states heavily represented in the bottom of the rankings.

Over the course of the year, SMA plans to look deeper into some of the issues addressed in this report and drive discussion on what we can do to improve patient care in the South.

Expand the tabs below to see individual state rankings.

Health Rankings SMA Territory Map

The statistics used to rank the states within the Southern Medical Association's territory were taken from America’s Health Rankings Annual Report, 2017 Edition.  ©2017 United Health Foundation. We encourage you to view the full report for additional statistics and information on all 50 states.

SMA's Vision
Physician-directed educational and leadership activities that include diverse teams of healthcare professionals interacting, collaborating, and learning for the purpose of improving the quality of patient care.

Find out how you can be a part of the solution. Contact Randy Glick, Executive Director, at rglick@sma.org.

2017 State Rankings

Alabama
Overall State Ranking - 47
no change

Behaviors

38

Drug Deaths

22

14.3 per 100,000 population

Excessive Drinking

5

14.2 % of adults

Obesity

47

35.7 % of adults

Physical Inactivity

44

29.4 % of adults

Smoking

42

21.5 % of adults

Community
& Environment

48

Air Pollution

39

8.9 micrograms per cubic meter

Children in Poverty

47

24.3 % of children

Infectious Disease

40

.363 mean z score

Occupational Fatalities

35

5.5 deaths per 100,000

Violent Crime

44

532 offenses per 100,000

Policy

23

Immunizations - Adolescents

36

-.333 mean z score

Immunizations - Children

7

77.3 of children 19-35 months

Public Health Funding

10

$113 per person

Uninsured

33

9.6 % of population

Clinical
Care

47

Dentists

48

43.7 per 100,000

Low Birthweight

48

10.4 % of live births

Mental Health Providers

50

85 per 100,000

Preventable Hospitalizations

46

62 discharges per 1,000 Medicare enrollees

Primary Care Physicians

42

119.3 per 100,000

Health
Outcomes

49

Cancer Deaths

43

210.6 per 100,000

Cardiovascular Deaths

49

339.6 per 100,000

Diabetes

49

14.6 % of adults

Infant Mortality

49

8.5 deaths per 1,000 live births

Premature Deaths

48

10,321 years lost before age 75 per 100,000

Arkansas
Overall State Ranking - 48
no change

Behaviors

45

Drug Deaths

14

12.3 per 100,000 population

Excessive Drinking

9

15.9 % of adults

Obesity

47

35.7 % of adults

Physical Inactivity

50

32.5 % of adults

Smoking

48

23.6 % of adults

Community
& Environment

42

Air Pollution

16

7.2 micrograms per cubic meter

Children in Poverty

39

21.4 % of children

Infectious Disease

41

.413 mean z score

Occupational Fatalities

44

7.5 deaths per 100,000

Violent Crime

45

551 offenses per 100,000

Policy

27

Immunizations - Adolescents

19

.135 mean z score

Immunizations - Children

39

67.8 of children 19-35 months

Public Health Funding

14

$107 per person

Uninsured

27

8.7 % of population

Clinical
Care

48

Dentists

50

41.2 per 100,000

Low Birthweight

43

9.2 % of live births

Mental Health Providers

26

213.3 per 100,000

Preventable Hospitalizations

45

61.8 discharges per 1,000 Medicare enrollees

Primary Care Physicians

43

115.4 per 100,000

Health
Outcomes

48

Cancer Deaths

47

219.5 per 100,000

Cardiovascular Deaths

47

323 per 100,000

Diabetes

47

13.5 % of adults

Infant Mortality

44

7.5 deaths per 1,000 live births

Premature Deaths

45

9,972 years lost before age 75 per 100,000

Florida
Overall State Ranking - 32
up 4

Behaviors

28

Drug Deaths

20

14.1 per 100,000 population

Excessive Drinking

19

17.5 % of adults

Obesity

14

27.4 % of adults

Physical Inactivity

46

29.8 % of adults

Smoking

16

15.5 % of adults

Community
& Environment

28

Air Pollution

13

6.8 micrograms per cubic meter

Children in Poverty

32

18.7 % of children

Infectious Disease

36

.277 mean z score

Occupational Fatalities

26

4.6 deaths per 100,000

Violent Crime

33

430 offenses per 100,000

Policy

46

Immunizations - Adolescents

30

-.180 mean z score

Immunizations - Children

41

67.1 of children 19-35 months

Public Health Funding

40

$63 per person

Uninsured

46

12.9 % of population

Clinical
Care

32

Dentists

30

52.3 per 100,000

Low Birthweight

35

8.6 % of live births

Mental Health Providers

41

144.8 per 100,000

Preventable Hospitalizations

35

53.6 discharges per 1,000 Medicare enrollees

Primary Care Physicians

32

131.6 per 100,000

Health
Outcomes

32

Cancer Deaths

14

182.1 per 100,000

Cardiovascular Deaths

14

229 per 100,000

Diabetes

40

11.8 % of adults

Infant Mortality

29

6.2 deaths per 1,000 live births

Premature Deaths

27

7,412 years lost before age 75 per 100,000

Georgia
Overall State Ranking - 41
no change

Behaviors

35

Drug Deaths

12

11.9 per 100,000 population

Excessive Drinking

7

15.1 % of adults

Obesity

30

31.4 % of adults

Physical Inactivity

44

29.4 % of adults

Smoking

28

17.9 % of adults

Community
& Environment

39

Air Pollution

41

9.0 micrograms per cubic meter

Children in Poverty

46

23.2 % of children

Infectious Disease

35

.267 mean z score

Occupational Fatalities

29

4.8 deaths per 100,000

Violent Crime

30

398 offenses per 100,000

Policy

33

Immunizations - Adolescents

10

.765 mean z score

Immunizations - Children

7

77.3 of children 19-35 months

Public Health Funding

35

$72 per person

Uninsured

47

13.4 % of population

Clinical
Care

42

Dentists

46

46.7 per 100,000

Low Birthweight

45

9.5 % of live births

Mental Health Providers

46

122.5 per 100,000

Preventable Hospitalizations

30

50.2 discharges per 1,000 Medicare enrollees

Primary Care Physicians

41

119.9 per 100,000

Health
Outcomes

41

Cancer Deaths

30

195.2 per 100,000

Cardiovascular Deaths

38

278.1 per 100,000

Diabetes

42

12.1 % of adults

Infant Mortality

45

7.6 deaths per 1,000 live births

Premature Deaths

35

8,185 years lost before age 75 per 100,000

Kentucky
Overall State Ranking - 42
up 3

Behaviors

47

Drug Deaths

49

25.5 per 100,000 population

Excessive Drinking

8

15.8 % of adults

Obesity

44

34.2 % of adults

Physical Inactivity

46

29.8 % of adults

Smoking

49

24.5 % of adults

Community
& Environment

26

Air Pollution

38

8.8 micrograms per cubic meter

Children in Poverty

38

20.7 % of children

Infectious Disease

7

-.643 mean z score

Occupational Fatalities

35

5.5 deaths per 100,000

Violent Crime

7

232 offenses per 100,000

Policy

16

Immunizations - Adolescents

28

-.138 mean z score

Immunizations - Children

16

74.5 of children 19-35 months

Public Health Funding

29

$79 per person

Uninsured

9

5.6 % of population

Clinical
Care

39

Dentists

25

54.6 per 100,000

Low Birthweight

38

8.7 % of live births

Mental Health Providers

27

194.6 per 100,000

Preventable Hospitalizations

50

76.6 discharges per 1,000 Medicare enrollees

Primary Care Physicians

40

120.6 per 100,000

Health
Outcomes

42

Cancer Deaths

50

233.6 per 100,000

Cardiovascular Deaths

44

296.4 per 100,000

Diabetes

46

13.1 % of adults

Infant Mortality

38

6.9 deaths per 1,000 live births

Premature Deaths

47

10,042 years lost before age 75 per 100,000

Louisiana
Overall State Ranking - 49
no change

Behaviors

50

Drug Deaths

32

17.7 per 100,000 population

Excessive Drinking

25

18.5 % of adults

Obesity

46

35.5 % of adults

Physical Inactivity

43

29.1 % of adults

Smoking

47

22.8 % of adults

Community
& Environment

50

Air Pollution

25

7.8 micrograms per cubic meter

Children in Poverty

49

28.3 % of children

Infectious Disease

50

.947 mean z score

Occupational Fatalities

44

7.5 deaths per 100,000

Violent Crime

46

566 offenses per 100,000

Policy

38

Immunizations - Adolescents

11

.680 mean z score

Immunizations - Children

44

66.8 of children 19-35 months

Public Health Funding

26

$86 per person

Uninsured

42

11.1 % of population

Clinical
Care

49

Dentists

42

48.2 per 100,000

Low Birthweight

49

10.6 % of live births

Mental Health Providers

18

257.1 per 100,000

Preventable Hospitalizations

47

65.8 discharges per 1,000 Medicare enrollees

Primary Care Physicians

33

131.1 per 100,000

Health
Outcomes

49

Cancer Deaths

46

218.2 per 100,000

Cardiovascular Deaths

46

316.2 per 100,000

Diabetes

42

12.1 % of adults

Infant Mortality

45

7.6 deaths per 1,000 live births

Premature Deaths

46

10,003 years lost before age 75 per 100,000

Maryland
Overall State Ranking - 16
up 2

Behaviors

7

Drug Deaths

32

17.7 per 100,000 population

Excessive Drinking

10

16.5 % of adults

Obesity

24

29.9 % of adults

Physical Inactivity

23

23.1 % of adults

Smoking

6

13.7 % of adults

Community
& Environment

22

Air Pollution

41

9 micrograms per cubic meter

Children in Poverty

4

9.6 % of children

Infectious Disease

16

-.353 mean z score

Occupational Fatalities

10

3.9 deaths per 100,000

Violent Crime

40

472 offenses per 100,000

Policy

17

Immunizations - Adolescents

21

.027 mean z score

Immunizations - Children

17

74.4 % of children 19-35 months

Public Health Funding

20

$95 per person

Uninsured

17

6.4 % of population

Clinical
Care

13

Dentists

9

70.7 per 100,000

Low Birthweight

35

8.6 % of live births

Mental Health Providers

23

219.3 per 100,000

Preventable Hospitalizations

20

46.7 discharges per 1,000 Medicare enrollees

Primary Care Physicians

8

184.9 per 100,000

Health
Outcomes

16

Cancer Deaths

21

187.8 per 100,000

Cardiovascular Deaths

31

255 per 100,000

Diabetes

29

10.8 % of adults

Infant Mortality

33

6.6 deaths per 1,000 live births

Premature Deaths

21

7,113 years lost before age 75 per 100,000

Mississippi
Overall State Ranking - 50
no change

Behaviors

49

Drug Deaths

8

11.5 per 100,000 population

Excessive Drinking

4

13.7 % of adults

Obesity

49

37.3 % of adults

Physical Inactivity

49

30.3 % of adults

Smoking

46

22.7 % of adults

Community
& Environment

44

Air Pollution

20

7.5 micrograms per cubic meter

Children in Poverty

50

29.9% of children

Infectious Disease

45

.660 mean z score

Occupational Fatalities

48

9.3 deaths per 100,000

Violent Crime

15

281 offenses per 100,000

Policy

47

Immunizations - Adolescents

50

-1.647 mean z score

Immunizations - Children

27

70.4 of children 19-35 months

Public Health Funding

30

$77 per person

Uninsured

45

12.3 % of population

Clinical
Care

50

Dentists

49

42.2 per 100,000

Low Birthweight

50

11.4 % of live births

Mental Health Providers

45

132.6per 100,000

Preventable Hospitalizations

48

70.2 discharges per 1,000 Medicare enrollees

Primary Care Physicians

47

105.9 per 100,000

Health
Outcomes

50

Cancer Deaths

48

226.7 per 100,000

Cardiovascular Deaths

50

352.5 per 100,000

Diabetes

48

13.6 % of adults

Infant Mortality

50

8.8 deaths per 1,000 live births

Premature Deaths

50

10,950 years lost before age 75 per 100,000

Missouri
Overall State Ranking - 40
down 3

Behaviors

39

Drug Deaths

30

17.6 per 100,000 population

Excessive Drinking

33

19.5 % of adults

Obesity

34

31.7 % of adults

Physical Inactivity

33

24.9 % of adults

Smoking

43

22.1 % of adults

Community
& Environment

35

Air Pollution

33

8.3 micrograms per cubic meter

Children in Poverty

30

18.6 % of children

Infectious Disease

22

-.167 mean z score

Occupational Fatalities

29

4.8 deaths per 100,000

Violent Crime

43

519 offenses per 100,000

Policy

42

Immunizations - Adolescents

45

-1.133 mean z score

Immunizations - Children

43

66.9 of children 19-35 months

Public Health Funding

45

$53 per person

Uninsured

31

9.4 % of population

Clinical
Care

41

Dentists

41

48.5 per 100,000

Low Birthweight

29

8.3 % of live births

Mental Health Providers

36

171.5 per 100,000

Preventable Hospitalizations

40

56.6 discharges per 1,000 Medicare enrollees

Primary Care Physicians

16

160.4 per 100,000

Health
Outcomes

40

Cancer Deaths

41

209 per 100,000

Cardiovascular Deaths

41

288.6 per 100,000

Diabetes

37

11.5 % of adults

Infant Mortality

30

6.3 deaths per 1,000 live births

Premature Deaths

40

8,558 years lost before age 75 per 100,000

North Carolina
Overall State Ranking - 33
down 1

Behaviors

26

Drug Deaths

19

14 per 100,000 population

Excessive Drinking

12

16.7 % of adults

Obesity

35

31.8 % of adults

Physical Inactivity

26

23.3 % of adults

Smoking

28

17.9 % of adults

Community
& Environment

31

Air Pollution

25

7.8 micrograms per cubic meter

Children in Poverty

35

19.3 % of children

Infectious Disease

48

.830 mean z score

Occupational Fatalities

10

3.9 deaths per 100,000

Violent Crime

26

372 offenses per 100,000

Policy

30

Immunizations - Adolescents

31

-.217 mean z score

Immunizations - Children

6

77.8 of children 19-35 months

Public Health Funding

42

$56 per person

Uninsured

41

10.8 % of population

Clinical
Care

31

Dentists

36

51.2 per 100,000

Low Birthweight

41

9.1 % of live births

Mental Health Providers

24

219.1 per 100,000

Preventable Hospitalizations

26

49 discharges per 1,000 Medicare enrollees

Primary Care Physicians

34

130.9 per 100,000

Health
Outcomes

33

Cancer Deaths

32

196.9 per 100,000

Cardiovascular Deaths

30

254.3 per 100,000

Diabetes

35

11.3 % of adults

Infant Mortality

42

7.2 deaths per 1,000 live births

Premature Deaths

33

7,889 years lost before age 75 per 100,000

Oklahoma
Overall State Ranking - 43
up 3

Behaviors

37

Drug Deaths

41

20.3 per 100,000 population

Excessive Drinking

2

12.8 % of adults

Obesity

42

32.8 % of adults

Physical Inactivity

41

28.5 % of adults

Smoking

36

19.6 % of adults

Community
& Environment

41

Air Pollution

30

8.1 micrograms per cubic meter

Children in Poverty

41

21.7 % of children

Infectious Disease

38

.280 mean z score

Occupational Fatalities

47

8.1 deaths per 100,000

Violent Crime

37

450 offenses per 100,000

Policy

49

Immunizations - Adolescents

34

-.323 mean z score

Immunizations - Children

42

67 of children 19-35 months

Public Health Funding

25

$87 per person

Uninsured

48

13.9 % of population

Clinical
Care

43

Dentists

39

49.6 per 100,000

Low Birthweight

22

7.9% of live births

Mental Health Providers

5

382.7 per 100,000

Preventable Hospitalizations

44

59.9 discharges per 1,000 Medicare enrollees

Primary Care Physicians

35

127.5 per 100,000

Health
Outcomes

43

Cancer Deaths

45

216.9 per 100,000

Cardiovascular Deaths

48

335.2 per 100,000

Diabetes

41

12 % of adults

Infant Mortality

47

7.7 deaths per 1,000 live births

Premature Deaths

44

9,951 years lost before age 75 per 100,000

South Carolina
Overall State Ranking - 44
down 2

Behaviors

42

Drug Deaths

23

14.5 per 100,000 population

Excessive Drinking

25

18.5 % of adults

Obesity

39

32.3 % of adults

Physical Inactivity

39

26.1% of adults

Smoking

39

20 % of adults

Community
& Environment

46

Air Pollution

25

7.8 micrograms per cubic meter

Children in Poverty

44

22.6 % of children

Infectious Disease

47

.793 mean z score

Occupational Fatalities

42

6.4 deaths per 100,000

Violent Crime

41

502 offenses per 100,000

Policy

44

Immunizations - Adolescents

49

-1.633 mean z score

Immunizations - Children

32

69.7 of children 19-35 months

Public Health Funding

32

$74 per person

Uninsured

39

10.5 % of population

Clinical
Care

46

Dentists

42

48.2 per 100,000

Low Birthweight

45

9.5 % of live births

Mental Health Providers

39

157.7 per 100,000

Preventable Hospitalizations

18

45.6 discharges per 1,000 Medicare enrollees

Primary Care Physicians

36

127 per 100,000

Health
Outcomes

44

Cancer Deaths

37

201.3 per 100,000

Cardiovascular Deaths

36

277 per 100,000

Diabetes

45

13 % of adults

Infant Mortality

36

6.7 deaths per 1,000 live births

Premature Deaths

42

9,131 years lost before age 75 per 100,000

Tennessee
Overall State Ranking - 45
down 1

Behaviors

43

Drug Deaths

39

19.9 per 100,000 population

Excessive Drinking

6

14.4 % of adults

Obesity

45

34.8 % of adults

Physical Inactivity

40

28.4 % of adults

Smoking

43

22.1 % of adults

Community
& Environment

40

Air Pollution

32

8.2 micrograms per cubic meter

Children in Poverty

42

21.9 % of children

Infectious Disease

15

-.380 mean z score

Occupational Fatalities

33

5.1 deaths per 100,000

Violent Crime

47

633 offenses per 100,000

Policy

35

Immunizations - Adolescents

47

-.373 mean z score

Immunizations - Children

40

67.4 of children 19-35 months

Public Health Funding

23

$94 per person

Uninsured

34

9.7 % of population

Clinical
Care

45

Dentists

40

49.2 per 100,000

Low Birthweight

41

9.1 % of live births

Mental Health Providers

43

138.2 per 100,000

Preventable Hospitalizations

43

59.3 discharges per 1,000 Medicare enrollees

Primary Care Physicians

27

138.5 per 100,000

Health
Outcomes

45

Cancer Deaths

44

216.5 per 100,000

Cardiovascular Deaths

45

308 per 100,000

Diabetes

44

12.7 % of adults

Infant Mortality

38

6.9 deaths per 1,000 live births

Premature Deaths

43

9,467 years lost before age 75 per 100,000

Texas
Overall State Ranking - 34
down 1

Behaviors

15

Drug Deaths

5

9.7 per 100,000 population

Excessive Drinking

32

19.4 % of adults

Obesity

43

33.6 % of adults

Physical Inactivity

34

25.2 % of adults

Smoking

10

14.3 % of adults

Community
& Environment

37

Air Pollution

39

8.9 micrograms per cubic meter

Children in Poverty

34

19.2 % of children

Infectious Disease

36

.277 mean z score

Occupational Fatalities

38

5.6 deaths per 100,000

Violent Crime

34

434 offenses per 100,000

Policy

50

Immunizations - Adolescents

39

-.493 mean z score

Immunizations - Children

33

69.5 of children 19-35 months

Public Health Funding

38

$67 per person

Uninsured

50

16.9 % of population

Clinical
Care

38

Dentists

30

52.3 per 100,000

Low Birthweight

28

8.2 % of live births

Mental Health Providers

49

98.3 per 100,000

Preventable Hospitalizations

34

53.2 discharges per 1,000 Medicare enrollees

Primary Care Physicians

45

112.9 per 100,000

Health
Outcomes

34

Cancer Deaths

11

180.9 per 100,000

Cardiovascular Deaths

34

261.1 per 100,000

Diabetes

33

11.2 % of adults

Infant Mortality

23

5.8 deaths per 1,000 live births

Premature Deaths

23

7,175 years lost before age 75 per 100,000

Virginia
Overall State Ranking - 19
no change

Behaviors

8

Drug Deaths

7

11.3 per 100,000 population

Excessive Drinking

15

17.4 % of adults

Obesity

21

29 % of adults

Physical Inactivity

26

23.3 % of adults

Smoking

15

15.3 % of adults

Community
& Environment

6

Air Pollution

20

7.5 micrograms per cubic meter

Children in Poverty

11

13 % of children

Infectious Disease

13

-.443 mean z score

Occupational Fatalities

20

4.2 deaths per 100,000

Violent Crime

4

218 offenses per 100,000

Policy

39

Immunizations - Adolescents

40

-.590 mean z score

Immunizations - Children

45

65.9 of children 19-35 months

Public Health Funding

33

$73 per person

Uninsured

28

8.9 % of population

Clinical
Care

19

Dentists

14

63.6 per 100,000

Low Birthweight

22

7.9 % of live births

Mental Health Providers

40

145.2 per 100,000

Preventable Hospitalizations

15

42.8 discharges per 1,000 Medicare enrollees

Primary Care Physicians

24

141.8 per 100,000

Health
Outcomes

19

Cancer Deaths

24

190.1 per 100,000

Cardiovascular Deaths

25

239.1 per 100,000

Diabetes

23

10.4 % of adults

Infant Mortality

23

5.8 deaths per 1,000 live births

Premature Deaths

19

6,696 years lost before age 75 per 100,000

West Virginia
Overall State Ranking - 46
down 3

Behaviors

48

Drug Deaths

50

35.3 per 100,000 population

Excessive Drinking

1

11.8 % of adults

Obesity

50

37.7 % of adults

Physical Inactivity

41

28.5 % of adults

Smoking

50

24.8 % of adults

Community
& Environment

36

Air Pollution

24

7.7 micrograms per cubic meter

Children in Poverty

48

27.3 % of children

Infectious Disease

1

-1.107 mean z score

Occupational Fatalities

46

7.7 deaths per 100,000

Violent Crime

24

358 offenses per 100,000

Policy

12

Immunizations - Adolescents

17

.283 mean z score

Immunizations - Children

47

64.7 of children 19-35 months

Public Health Funding

1

$296 per person

Uninsured

10

5.7 % of population

Clinical
Care

44

Dentists

44

47.9 per 100,000

Low Birthweight

45

9.5 % of live births

Mental Health Providers

48

112.7 per 100,000

Preventable Hospitalizations

49

75 discharges per 1,000 Medicare enrollees

Primary Care Physicians

17

159.6 per 100,000

Health
Outcomes

46

Cancer Deaths

49

226.9 per 100,000

Cardiovascular Deaths

43

295.5 per 100,000

Diabetes

50

15 % of adults

Infant Mortality

41

7.1 deaths per 1,000 live births

Premature Deaths

49

10,478 years lost before age 75 per 100,000

(2017). Assets.americashealthrankings.org. Retrieved 27 December 2017, from https://assets.americashealthrankings.org/app/uploads/2017annualreport.pdf

Elizabeth Cohen, S. (2017). America's healthiest and least healthy statesCNN. Retrieved 27 December 2017, from http://www.cnn.com/2017/12/12/health/2017-health-disparities-report/index.html

Ridding the World of Rhabdo and All Childhood Cancers

January 16, 2018 // Randy Glick

Editor’s Note: September is Childhood Cancer Awareness Month, and SMA's Jennifer Price had the opportunity to speak with one mother who is honoring her daughter’s life and legacy by giving back and raising awareness about pediatric cancer.

How It Began

When her daughter Elaine was diagnosed with metastatic alveolar rhabdomyosarcoma, Laura Roberts found herself in a position parents neither envy nor envision. “Cancer was the furthest thing from my mind,” Laura recalls. “I told Elaine, ‘This will be a year out of your life and then you will be as good as new.’” Laura chronicled Elaine’s journey that began in fall 2014 after the 15-year-old, fun-loving teenager and member of the Thompson High School (Alabaster, AL) Tennis Team complained of foot pain. When the first X-rays came back negative, a diagnosis of tendonitis was given and Elaine, feeling better, played through the spring 2015 tennis season. The pain returned, during which time more negative X-rays led to an MRI and the diagnosis of rhabdomyosarcoma in May 2015.

In the days following the diagnosis, the family researched hospitals that could best treat Elaine. “We had Children’s of Alabama and UAB (University of Alabama at Birmingham) close by, but we also consulted MD Anderson in Houston, and Children’s Hospital in Boston,” Laura said. Upon learning that Children’s of Alabama utilized the same protocols of chemotherapy and radiation as those in Houston and Boston, the decision was made to stay close to home. “It’s what Elaine wanted and we had our family and friends, our support here,” she added. “That made it much easier.” And so did Elaine’s medical team at Children’s. “The love and compassion these doctors, nurses, and staff showed her were wonderful,” Laura said. “They loved her.”

Finding Comfort in Faith, Family, and Friends

Throughout Elaine’s treatment, which initially yielded encouraging results, Laura, who purposely chose not to consult “Dr. Google” regarding statistics and prognoses, always maintained her strong composure for Elaine. “Her attitude was paramount,” she said. “I was the cheerleader, plus I kept her focused on school work and other future things like when she was going to return to tennis. I kept her mind on getting well.”

When anxiety and doubt would cloud Laura’s mind, she made sure to take some time for herself. “If I cried, it was normally in the shower. If Elaine viewed me as doubting that she would make a full recovery then she might [have the same doubts],” Laura recalled. “If I felt anxious I would sometimes go outside with the dogs and call a family member or a friend to vent. I had to be talked off the ledge a couple of times, and I ate a lot of Cheetos!” Even with some old-fashioned comfort food, Laura found her greatest solace in God. “The main thing I did when I felt very anxious was go to my Bible,” she said. “He will and did provide a peace that passes all understanding.” It is this serenity that allowed Laura to be calmer and to continue in a productive way that was helpful to Elaine. “She wanted me 90% of the time and I had to be strong and able to be there for her,” Laura said. “Jesus was the best decompressor I had.”

As Laura took care of Elaine, family and friends rallied around them, never leaving their side. “God truly provided for us with a spectacular support system,” Laura said. “It’s pretty amazing how people from all seasons of my life came to our aid to help us in any and every way they could.” These included her family who “was right in the trenches with me the entire time”; her “incredibly supportive” boss, colleagues, and owner of the company; her church family; and the Thompson Tennis Team, coaches, and parents. Laura’s Auburn University sorority sisters also stepped in, making sure that when Elaine was placed in hospice care, they were there to help by sitting with her and pushing the pain pump button at the appropriate time throughout the night, which allowed Elaine to sleep pain free and Laura to get some much needed rest. “They did something for me that I can never repay,” Laura shared. “Without them, I never would have made it through.” Laura also found strength through the kindness of strangers via Elaine’s CaringBridge website. “People who read our updates were encouraging, and some of these people I didn’t even know,” Laura recalled. “There were people all over Alabama and the entire country praying for us.”

Unfortunately, by January 2016, Elaine’s treatment protocol was no longer effective and the cancer was spreading. Because she was now only 16 years old, she wasn’t eligible for adult clinical trials. “There were no trials going on that Elaine could participate in and the chemo drugs she had been taking were developed decades ago. We really didn’t have anything out there to try,” said Laura. Sadly, Elaine’s battle ended February 6, 2016, six weeks after her father Brent passed away unexpectedly. But, Elaine’s story doesn’t end there…a new chapter was beginning.

A New Chapter…The Elaine Roberts Foundation

Shortly after her daughter’s passing, Laura established the Elaine Roberts Foundation with the purpose of educating people about pediatric cancer and to raise money for research to cure childhood cancers. “Elaine’s outcome is not what we wanted, but the cancer was ugly, rare, and aggressive,” she said. “We need better treatments for this particular type of cancer and other pediatric cancers. Some are very beatable, but we need all cancers to be cured.” It is the desire for no other families to suffer the loss she did, as well as a determination to fund research that will ultimately lead to a cure that drive Laura in her dedication and devotion to the Foundation. “The reality is my daughter lost her life,” she said. “But through that, I have seen how much people want to help; they may not know just how.” Through the Foundation, those wanting to help can do so by simply visiting the Foundation website and finding a way – whether through a variety of fundraising and volunteer opportunities or a monetary contribution – to “rid the world of rhabdo and ALL childhood cancers”.

New Medicare Cards

New Medicare Cards – 5 Ways for Healthcare Providers to Get Ready

January 11, 2018 // Randy Glick
New Medicare Cards - Are You Ready?

Medicare is taking steps to remove Social Security numbers from Medicare cards. Through this initiative the Centers for Medicare & Medicaid Services (CMS) will prevent fraud, fight identity theft and protect essential program funding and the private healthcare and financial information of our Medicare beneficiaries.

CMS will issue new Medicare cards with a new unique, randomly-assigned number called a Medicare Beneficiary Identifier (MBI) to replace the existing Social Security-based Health Insurance Claim Number (HICN) both on the cards and in various CMS systems. New cards will begin mailing to people with Medicare benefits in April 2018. All Medicare cards will be replaced by April 2019.

CMS is committed to helping providers by giving them the tools they need and wants to make this process as easy as possible for you, your patients, and your staff. Based on feedback from healthcare providers, practice managers and other stakeholders, CMS is developing capabilities where doctors and other healthcare providers will be able to look up the new MBI through a secure tool at the point of service. To make this change easier for you and your business operations, there is a 21-month transition period where all healthcare providers will be able to use either the MBI or the HICN for billing purposes.

Therefore, even though your systems will need to be able to accept the new MBI format by April 2018, you can continue to bill and file healthcare claims using a patient’s HICN during the transition period. We encourage you to work with your billing vendor to make sure that your system will be updated to reflect these changes as well.

You will need to be ready for new Medicare cards and MBIs beginning in April 2018.

Here are 5 steps you can take today to help your office or healthcare facility get ready:

  1. Go to the CMS provider website and sign-up for the weekly MLN Connects® newsletter.
  2. Attend the CMS quarterly calls to get more information. Calls are scheduled in the MLN Connects newsletter.
  3. Verify all of your Medicare patients’ addresses. If the addresses you have on file are different than the Medicare address you get on electronic eligibility transactions, ask your patients to contact Social Security and update their Medicare records.
  4. Work with CMS to help your Medicare patients adjust to their new Medicare card. When available later this fall, you can display helpful information about the new Medicare cards. Hang posters about the change in your offices to help us spread the word.
  5. Test your system changes and work with your billing office staff to be sure your office is ready to use the new MBI format.

To learn more, visit: cms.gov

New Medicare Cards

New Medicare Card Project Special Open Door Forum - January 23

Tuesday, January 23 from 2 to 3 pm ET

This call will educate State Medicaid Agencies, Medicaid providers, Managed Care Organizations, Medicaid partners, and other Medicaid stakeholders about the change from Social Security Number-based Health Insurance Claim Numbers to new Medicare Beneficiary Identifiers (MBIs). A question and answer session follows the presentation. This is the same presentation given on  November 9.

CMS discusses:

  • Background and implementation
  • MBI format
  • Timeline and milestones, including the transition period
  • Beneficiary outreach and education
  • How to get ready for the new number

Dial in at least 15 minutes prior to the start of the call.

For More Information

Provider Ombudsman, Dr. Eugene Freund: NMCProviderQuestions@cms.hhs.gov

Southern Medical Journal

SMJ : January 2018 Issue

January 4, 2018 // Randy Glick
January 2018 SMJ Cover

The Southern Medical Journal is the official, peer-reviewed journal of the Southern Medical Association. It has a multidisciplinary and inter-professional focus that covers a broad range of topics relevant to physicians and other healthcare specialists, including medicine; surgery; women’s and children’s health; mental health; emergency and disaster medicine; public health and environmental medicine; bioethics and medical education; and quality health care, patient safety, and best practices.

Southern Medical Journal Vol. 111 • No. 1 • January 2018

Emergency Medicine and Disaster Preparedness

Association Between Perceived Discrimination and Emergency Department Use Among Safety-Net Patients in the Southwestern United States 
Kimberly R. Enard, PhD, Lucinda Nevarez, PhD, LMSW, and Deborah M. Ganelin, MHA

Helmets Matter: Kentucky Motorcycle Crash Victims Seen at a Tennessee Trauma Center 
George M. Testerman, MD, Daniel C. Prior, DO, Tamie D. Wells, MS4, William C. Sumner, MS4, Jeffrey T. Johnston, MD, Sarah E. Rollins, MD, and Jeremy M. Meyer, MD

Women’s & Children’s Health

Dietary and Nutrition Recommendations in Pediatric Primary Care: A Call to Action 
Sayward E. Harrison, PhD, and Deborah Greenhouse, MD

Comprehension of Pelvic Organ Prolapse and Urinary Incontinence in Southern Appalachian Women
Danielle Hobdy, MD, R. Keith Huffaker, MD, and Beth Bailey, PhD

Associations of Prepregnancy Morbid Obesity and Prenatal Depression with Gestational Weight Gain
Hema Chagarlamudi, MPH, MHS, Juhee Kim, ScD, MS, and Edward Newton, MD

Bioethics & Medical Education

Getting it RITE: Impact of a Dedicated Hospital Medicine Curriculum for Residents 
Doris Lin, MD, MS, Chirayu Shah, MD, MEd, Steffanie Campbell, MD, Jeffrey T. Bates, MD, and Erica Lescinskas, MD

Medicine & Medical Specialties

E-Cigarette Toxicity? 
Gulay Tegin, MD, Hema Madhuri Mekala, MD, Simrat Kaur Sarai, MD, and Steven Lippmann, MD

A Brief Drug Class Review: Considerations for Statin Use, Toxicity, and Drug Interactions 
James M. Wooten, PharmD

Measuring Adherence to Hepatitis C Direct-Acting Antiviral Medications: Using the VAS in an HCV Treatment Clinic 
Mary Jane Burton, MD, Andrew C. Voluse, PhD, Amee B. Patel, PhD, and Deborah Konkle-Parker, PhD

Eradication Rate of Helicobacter pylori on the US–Mexico Border Using the Urea Breath Test 
Roy P. Liu, MD, Roberta Romero, DNP, Jerzy Sarosiek, MD, Christopher Dodoo, MS, Alok K. Dwivedi, PhD, and Marc J. Zuckerman, MD

Surgery & Surgical Specialties

Femorofemoral Crossover Bypass Graft Has Excellent Patency When Performed with EVAR for AAA with UIOD 
Akinfemi A. Akingboye, MBBS, MD(Res), Bijendra Patel, MBBS, MS, and Frank W. Cross, MBBS, MS

Multidisciplinary Perioperative Management of Pulmonary Arterial Hypertension in Patients Undergoing Noncardiac Surgery 
José L. Díaz-Gómez, MD, Juan G. Ripoll, MD, Isabel Mira-Avendano, MD, John E. Moss, MD, Gavin D. Divertie, MD, Ryan D. Frank, MS, and Charles D. Burger, MD

SMA Services, Inc.

Sponsored by SMA Services, Inc.

Posted in: SMJ

6 Questions to ask about Medical Malpractice Insurance

June 28, 2016 // Randy Glick

Make sure you have the best medical malpractice coverage available by asking these 6 medical malpractice questions.

1. Do you have the consent to settle?

Does your malpractice policy allow you to decline settling and fight unjust claims in court to the very end?

If you have a “Consent to Settle Clause” in you policy, in order to settle a case, the insurance company must have your approval. If you reject this settlement, you reject it without further penalty.

For instance: if you purchase a policy with $1M limits and you lose at trial after declining to settle, your insurance company will still be required to pay up to a $1M verdict.

Malpractice Suits are very personal, and the Southern Medical Association wants you to have the ability to fight a claim to the very end.

2. Does your policy have a dreaded hammer clause?

Having a hammer clause in your malpractice policy can be problematic in the event of a claim.

A Hammer Clause in your policy may read like this:

“Insurer will not settle or compromise any claim without the consent of the insured. If, however, the insured refuses to consent to a settlement or compromise recommended by insurer and elects to contest such claim or continue legal proceedings in connection with such claim, then insurer’s liability for the claim shall not exceed the amount for which the claim could have been so settled, plus claims expenses incurred up to the date of such refusal.”

Avoid policies with these hammer clauses at all cost.

A ‘consent to settle’ policy that requires the insurance company to have your approval in order to settle a case is most desirable.

The SMA Service’s exclusive Medical Malpractice program does not have a hammer clause and the consent to settle lies with the physician. We’ve aggregated the over 4,000 Southern Medical Association members to provide you with the underwriting discounts and concessions to independent physicians that would normally be reserved for large hospital systems.

3. Is Claims-Made or Occurrence right for you?

Every malpractice insurance policy is going to contain a method, manner or time period in which a claim can be filed. The majority of insurance policies are written using the occurrence form but many others, especially professional liability policies are written on a claims-made form. These different forms have a major effect on your responsibility in the event of a claim, the actual cost of the policy and most importantly, how the company will respond to the claim:

Occurrence:

This policy covers claims made for injuries sustained during the life of the policy; even if the claim is filed after the policy has been canceled. An occurrence is an event that can result in the filing of an insurance claim.

Claims Made:

A claims-made policy provides coverage when a claim is made against the policy, regardless of when the claim event took place as long as the claim event took place after the ‘retroactive date’. If an insured elects to change insurance companies from one year to the next, it is important that the new carrier offer “retroactive” coverage back to the retroactive date to prevent any gaps in coverage.

While there are certainly pros and cons to both policies; in most cases, the claims made policy form is the most competitively priced option for the independent physicians.

4. What triggers a claim on your Malpractice Insurance Policy?

Medical Malpractice claims made policies are issued one of two ways; they will either have an incident trigger or a written demand trigger.

Incident Trigger:

If your malpractice coverage has an incident trigger, the moment you report a bad outcome to your carrier they become responsible for any future claims based on this incident.

Written Demand Triggers:

Under a written demand trigger, you may know of a bad outcome but a carrier will not accept responsibility of a claim until a written demand for money or a lawsuit has been made.

If affordable, an incident trigger form should always be considered.

Demand Trigger policies may force a physician practice with a known incident (however large or small) to remain with their current insurance company for years to avoid a gap in coverage. There is the potential that the carrier could significantly raise rates or adversely change coverage forms while awaiting a written demand or the Statue of Limitations to pass.

5. Does your Malpractice Carrier provide coverage for privacy liability and regulatory violations?

Electronic record-keeping and digital communications are now used by most businesses. Too often businesses underestimate the risks of data security breach & regulatory violations.

It is important that you know if your general liability or malpractice insurance covers privacy and regulatory exposures. Unless you purchase standalone coverage, your policies most likely specifically exclude data and regulatory related risk.

6. Can you avoid paying for “Tail Insurance” at retirement?

Have you budgeted for the cost of tail insurance when you retire?

Tail coverage can be extremely expensive. Depending on the carrier, the cost of your tail insurance could range from 150% to 250% of your final year’s premium. This is a sizable amount for any physician but can be especially expensive for high risk specialties. Many standard malpractice carriers have free retirement tail provisions after the age of 55 and after 5 consecutive years of coverage. If you retirement is around the corner, this provision may be prohibiting you from looking at more affordable malpractice options.

SMA's Medical Malpractice Insurance Program

The Southern Medical Association has created a highly discounted medical malpractice insurance program for SMA Members that’s available to physician practices of all sizes and specialties. A few minutes of your time could save you up to 50% off your current rates. Call 844.8EASYWIN today or click the Easy Win button below to find out more...

Email easywin@sma.org to have our representative review your current policy.

Student Loans 101 – Webinar Recording with LendKey

June 28, 2016 // Randy Glick

SMA Partner LendKey Explains Student Loan Options for Medical Professionals

Our partners at LendKey have put together an informative, step-by-step plan to help you save money and pay off your student loans.  The student loans webinar recording is about 30 minutes and will teach you:

  • Where to find the details on all your student loans
  • How to organize your student debt
  • Federal repayment plan options
  • The difference between consolidation and refinancing
  • How to refinance your student loans
  • How much you can save by refinancing

Medical professionals stand to save an average of over $35,000 by refinancing their student loans and LendKey lets you compare refinancing options from over 300 not-for-profit lenders.

Check your rate and find out how much you can save by refinancing.

 CLICK HERE, It's fast and easy.

Illegal Immigration and the Threat of Infectious Disease

February 18, 2015 // Randy Glick

There's a growing health concern over illegal immigrants bringing infectious diseases into the United States. Approximately 500,000 legal immigrants and 80,000 refugees come to the United States each year, and an additional 700,000 illegal immigrants enter annually, and three-quarters of these illegal immigrants come from Mexico, El Salvador, Guatemala, and Honduras.

Legal immigrants and refugees are required to have a medical examination for migration to the United States, while they are still overseas. This is the responsibility of the Centers for Disease Control and Prevention (CDC), which provide instructions to the Panel Physicians who conduct the medical exams. The procedure consists of a physical examination, an evaluation (skin test/chest x-ray examination) for tuberculosis (TB), and blood test for syphilis. Requirements for vaccination are based on recommendations from the Advisory Committee on Immunization Practices.

Individuals who fail the exam due to certain health-related conditions are not admitted to the United States. Such conditions include drug addiction or communicable diseases of public health significance such as TB, syphilis, gonorrhoea, leprosy, and a changing list of current threats such as polio, cholera, diphtheria, smallpox, or severe acute respiratory syndromes. Illegal immigrants crossing into the United States could bring any of these threats, however. Southern Texas Border Patrol agent Chris Cabrera warns: "What's coming over into the US could harm everyone. We are starting to see scabies, chicken pox, methicillin-resistant Staphylococcus aureus infections, and different viruses."

Illegal immigration may expose Americans to diseases that have been virtually eradicated, but are highly contagious, as in the case of TB. This disease rose by 20% globally from 1985 to 1991, and was declared a worldwide emergency by the World Health Organization (WHO) in 1995. Furthermore, TB frequently occurs in connection with the human immunodeficiency virus. Fortunately, more than 90% of Central Americans are vaccinated against TB, according to the WHO.

The federal government's Department of Homeland Security has public health controls in place to minimize any possible health risks, including medical units at the busiest border stations and measures to protect Customs and Border Protection including gloves, long-sleeve shirts, and frequent hand washing. In addition, the CDC’s Division of Global Migration and Quarantine has measures in place to protect the population from communicable diseases. The agency works through a variety of activities to prevent the introduction, transmission, and spread of communicable diseases in the United States.  It operates Quarantine Stations at ports of entry; establishes standards for medical examination of persons headed legally for the United States; and administers interstate and foreign quarantine regulations governing the international and interstate movement of humans, animals, and cargo. The agency also alerts state authorities of newly arrived immigrants with certain health conditions.

The CDC's Epidemiology Team also monitors infectious diseases among immigrants and refugees with their disease surveillance systems, investigations of disease outbreaks, and their Migrant Serum Bank of anonymous immigrant and refugee blood samples available for research. Other branches of the CDC protect US health through ensuring the quality of overseas medical exams required of immigrants and refugees.

Concerns have been specifically raised about children, due to the risk of infections spreading in public schools. But the CDC currently believes that the children arriving at US borders "pose little risk of spreading infectious diseases to the general public." The CDC also confirms that vaccinations are provided to all children who do not have valid documentation. All children are initially screened for visible and obvious health issues (for example, lice, rashes, diarrhea, and cough) when they first arrive at Customs and Border Protection facilities.

References:

Details of the CDC's Immigrant, Refugee, and Migrant Health Branch:
www.cdc.gov/ncezid/dgmq/irmh-fact-sheet.html

Factsheet on Protecting America's Health at US Ports of Entry:
www.cdc.gov/ncezid/dgmq/pdf/quarantine-fact-sheet.pdf

SMA Menu