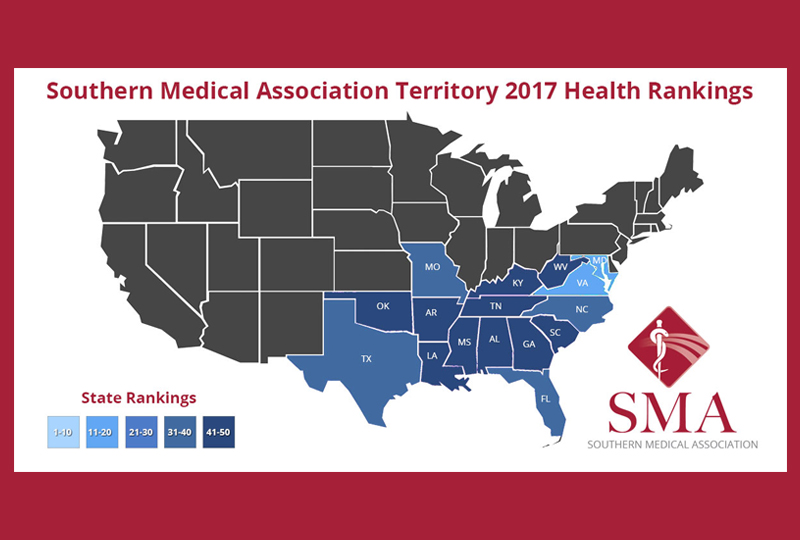
Health Rankings in the South
For the past 28 years, the United Health Foundation has produced an annual report assessing the nation’s health on a state-by-state basis. The report is a great tool to measure progress, identify emerging trends, and drive action for improving public health.
The rankings have been broken down into four core measures which directly influence health outcomes:
- Behaviors
- Community & Environment
- Policy
- Clinical Care
Here we take a look at the states that fall within the territory of the Southern Medical Association.
Originally founded to address the needs of patients in the Southeastern United States( Alabama, Arkansas, Florida, Georgia, Kentucky, Louisiana, Maryland/DC, Mississippi, Missouri, North Carolina, Oklahoma, South Carolina, Tennessee, Texas, Virginia, West Virginia), SMA membership currently includes members from all 50 states and international members.
It should be quite obvious that we are in an area of great need, with the southern states heavily represented in the bottom of the rankings.
Over the course of the year, SMA plans to look deeper into some of the issues addressed in this report and drive discussion on what we can do to improve patient care in the South.
Expand the tabs below to see individual state rankings.

The statistics used to rank the states within the Southern Medical Association's territory were taken from America’s Health Rankings Annual Report, 2017 Edition. ©2017 United Health Foundation. We encourage you to view the full report for additional statistics and information on all 50 states.
SMA's Vision
Physician-directed educational and leadership activities that include diverse teams of healthcare professionals interacting, collaborating, and learning for the purpose of improving the quality of patient care.
Find out how you can be a part of the solution. Contact Randy Glick, Executive Director, at [email protected].
2017 State Rankings

Behaviors
38
Drug Deaths
22
14.3 per 100,000 population
Excessive Drinking
5
14.2 % of adults
Obesity
47
35.7 % of adults
Physical Inactivity
44
29.4 % of adults
Smoking
42
21.5 % of adults
Community
& Environment
48
Air Pollution
39
8.9 micrograms per cubic meter
Children in Poverty
47
24.3 % of children
Infectious Disease
40
.363 mean z score
Occupational Fatalities
35
5.5 deaths per 100,000
Violent Crime
44
532 offenses per 100,000
Policy
23
Immunizations - Adolescents
36
-.333 mean z score
Immunizations - Children
7
77.3 of children 19-35 months
Public Health Funding
10
$113 per person
Uninsured
33
9.6 % of population
Clinical
Care
47
Dentists
48
43.7 per 100,000
Low Birthweight
48
10.4 % of live births
Mental Health Providers
50
85 per 100,000
Preventable Hospitalizations
46
62 discharges per 1,000 Medicare enrollees
Primary Care Physicians
42
119.3 per 100,000
Health
Outcomes
49
Cancer Deaths
43
210.6 per 100,000
Cardiovascular Deaths
49
339.6 per 100,000
Diabetes
49
14.6 % of adults
Infant Mortality
49
8.5 deaths per 1,000 live births
Premature Deaths
48
10,321 years lost before age 75 per 100,000

Behaviors
45
Drug Deaths
14
12.3 per 100,000 population
Excessive Drinking
9
15.9 % of adults
Obesity
47
35.7 % of adults
Physical Inactivity
50
32.5 % of adults
Smoking
48
23.6 % of adults
Community
& Environment
42
Air Pollution
16
7.2 micrograms per cubic meter
Children in Poverty
39
21.4 % of children
Infectious Disease
41
.413 mean z score
Occupational Fatalities
44
7.5 deaths per 100,000
Violent Crime
45
551 offenses per 100,000
Policy
27
Immunizations - Adolescents
19
.135 mean z score
Immunizations - Children
39
67.8 of children 19-35 months
Public Health Funding
14
$107 per person
Uninsured
27
8.7 % of population
Clinical
Care
48
Dentists
50
41.2 per 100,000
Low Birthweight
43
9.2 % of live births
Mental Health Providers
26
213.3 per 100,000
Preventable Hospitalizations
45
61.8 discharges per 1,000 Medicare enrollees
Primary Care Physicians
43
115.4 per 100,000
Health
Outcomes
48
Cancer Deaths
47
219.5 per 100,000
Cardiovascular Deaths
47
323 per 100,000
Diabetes
47
13.5 % of adults
Infant Mortality
44
7.5 deaths per 1,000 live births
Premature Deaths
45
9,972 years lost before age 75 per 100,000

Behaviors
28
Drug Deaths
20
14.1 per 100,000 population
Excessive Drinking
19
17.5 % of adults
Obesity
14
27.4 % of adults
Physical Inactivity
46
29.8 % of adults
Smoking
16
15.5 % of adults
Community
& Environment
28
Air Pollution
13
6.8 micrograms per cubic meter
Children in Poverty
32
18.7 % of children
Infectious Disease
36
.277 mean z score
Occupational Fatalities
26
4.6 deaths per 100,000
Violent Crime
33
430 offenses per 100,000
Policy
46
Immunizations - Adolescents
30
-.180 mean z score
Immunizations - Children
41
67.1 of children 19-35 months
Public Health Funding
40
$63 per person
Uninsured
46
12.9 % of population
Clinical
Care
32
Dentists
30
52.3 per 100,000
Low Birthweight
35
8.6 % of live births
Mental Health Providers
41
144.8 per 100,000
Preventable Hospitalizations
35
53.6 discharges per 1,000 Medicare enrollees
Primary Care Physicians
32
131.6 per 100,000
Health
Outcomes
32
Cancer Deaths
14
182.1 per 100,000
Cardiovascular Deaths
14
229 per 100,000
Diabetes
40
11.8 % of adults
Infant Mortality
29
6.2 deaths per 1,000 live births
Premature Deaths
27
7,412 years lost before age 75 per 100,000

Behaviors
35
Drug Deaths
12
11.9 per 100,000 population
Excessive Drinking
7
15.1 % of adults
Obesity
30
31.4 % of adults
Physical Inactivity
44
29.4 % of adults
Smoking
28
17.9 % of adults
Community
& Environment
39
Air Pollution
41
9.0 micrograms per cubic meter
Children in Poverty
46
23.2 % of children
Infectious Disease
35
.267 mean z score
Occupational Fatalities
29
4.8 deaths per 100,000
Violent Crime
30
398 offenses per 100,000
Policy
33
Immunizations - Adolescents
10
.765 mean z score
Immunizations - Children
7
77.3 of children 19-35 months
Public Health Funding
35
$72 per person
Uninsured
47
13.4 % of population
Clinical
Care
42
Dentists
46
46.7 per 100,000
Low Birthweight
45
9.5 % of live births
Mental Health Providers
46
122.5 per 100,000
Preventable Hospitalizations
30
50.2 discharges per 1,000 Medicare enrollees
Primary Care Physicians
41
119.9 per 100,000
Health
Outcomes
41
Cancer Deaths
30
195.2 per 100,000
Cardiovascular Deaths
38
278.1 per 100,000
Diabetes
42
12.1 % of adults
Infant Mortality
45
7.6 deaths per 1,000 live births
Premature Deaths
35
8,185 years lost before age 75 per 100,000

Behaviors
47
Drug Deaths
49
25.5 per 100,000 population
Excessive Drinking
8
15.8 % of adults
Obesity
44
34.2 % of adults
Physical Inactivity
46
29.8 % of adults
Smoking
49
24.5 % of adults
Community
& Environment
26
Air Pollution
38
8.8 micrograms per cubic meter
Children in Poverty
38
20.7 % of children
Infectious Disease
7
-.643 mean z score
Occupational Fatalities
35
5.5 deaths per 100,000
Violent Crime
7
232 offenses per 100,000
Policy
16
Immunizations - Adolescents
28
-.138 mean z score
Immunizations - Children
16
74.5 of children 19-35 months
Public Health Funding
29
$79 per person
Uninsured
9
5.6 % of population
Clinical
Care
39
Dentists
25
54.6 per 100,000
Low Birthweight
38
8.7 % of live births
Mental Health Providers
27
194.6 per 100,000
Preventable Hospitalizations
50
76.6 discharges per 1,000 Medicare enrollees
Primary Care Physicians
40
120.6 per 100,000
Health
Outcomes
42
Cancer Deaths
50
233.6 per 100,000
Cardiovascular Deaths
44
296.4 per 100,000
Diabetes
46
13.1 % of adults
Infant Mortality
38
6.9 deaths per 1,000 live births
Premature Deaths
47
10,042 years lost before age 75 per 100,000

Behaviors
50
Drug Deaths
32
17.7 per 100,000 population
Excessive Drinking
25
18.5 % of adults
Obesity
46
35.5 % of adults
Physical Inactivity
43
29.1 % of adults
Smoking
47
22.8 % of adults
Community
& Environment
50
Air Pollution
25
7.8 micrograms per cubic meter
Children in Poverty
49
28.3 % of children
Infectious Disease
50
.947 mean z score
Occupational Fatalities
44
7.5 deaths per 100,000
Violent Crime
46
566 offenses per 100,000
Policy
38
Immunizations - Adolescents
11
.680 mean z score
Immunizations - Children
44
66.8 of children 19-35 months
Public Health Funding
26
$86 per person
Uninsured
42
11.1 % of population
Clinical
Care
49
Dentists
42
48.2 per 100,000
Low Birthweight
49
10.6 % of live births
Mental Health Providers
18
257.1 per 100,000
Preventable Hospitalizations
47
65.8 discharges per 1,000 Medicare enrollees
Primary Care Physicians
33
131.1 per 100,000
Health
Outcomes
49
Cancer Deaths
46
218.2 per 100,000
Cardiovascular Deaths
46
316.2 per 100,000
Diabetes
42
12.1 % of adults
Infant Mortality
45
7.6 deaths per 1,000 live births
Premature Deaths
46
10,003 years lost before age 75 per 100,000

Behaviors
7
Drug Deaths
32
17.7 per 100,000 population
Excessive Drinking
10
16.5 % of adults
Obesity
24
29.9 % of adults
Physical Inactivity
23
23.1 % of adults
Smoking
6
13.7 % of adults
Community
& Environment
22
Air Pollution
41
9 micrograms per cubic meter
Children in Poverty
4
9.6 % of children
Infectious Disease
16
-.353 mean z score
Occupational Fatalities
10
3.9 deaths per 100,000
Violent Crime
40
472 offenses per 100,000
Policy
17
Immunizations - Adolescents
21
.027 mean z score
Immunizations - Children
17
74.4 % of children 19-35 months
Public Health Funding
20
$95 per person
Uninsured
17
6.4 % of population
Clinical
Care
13
Dentists
9
70.7 per 100,000
Low Birthweight
35
8.6 % of live births
Mental Health Providers
23
219.3 per 100,000
Preventable Hospitalizations
20
46.7 discharges per 1,000 Medicare enrollees
Primary Care Physicians
8
184.9 per 100,000
Health
Outcomes
16
Cancer Deaths
21
187.8 per 100,000
Cardiovascular Deaths
31
255 per 100,000
Diabetes
29
10.8 % of adults
Infant Mortality
33
6.6 deaths per 1,000 live births
Premature Deaths
21
7,113 years lost before age 75 per 100,000

Behaviors
49
Drug Deaths
8
11.5 per 100,000 population
Excessive Drinking
4
13.7 % of adults
Obesity
49
37.3 % of adults
Physical Inactivity
49
30.3 % of adults
Smoking
46
22.7 % of adults
Community
& Environment
44
Air Pollution
20
7.5 micrograms per cubic meter
Children in Poverty
50
29.9% of children
Infectious Disease
45
.660 mean z score
Occupational Fatalities
48
9.3 deaths per 100,000
Violent Crime
15
281 offenses per 100,000
Policy
47
Immunizations - Adolescents
50
-1.647 mean z score
Immunizations - Children
27
70.4 of children 19-35 months
Public Health Funding
30
$77 per person
Uninsured
45
12.3 % of population
Clinical
Care
50
Dentists
49
42.2 per 100,000
Low Birthweight
50
11.4 % of live births
Mental Health Providers
45
132.6per 100,000
Preventable Hospitalizations
48
70.2 discharges per 1,000 Medicare enrollees
Primary Care Physicians
47
105.9 per 100,000
Health
Outcomes
50
Cancer Deaths
48
226.7 per 100,000
Cardiovascular Deaths
50
352.5 per 100,000
Diabetes
48
13.6 % of adults
Infant Mortality
50
8.8 deaths per 1,000 live births
Premature Deaths
50
10,950 years lost before age 75 per 100,000

Behaviors
39
Drug Deaths
30
17.6 per 100,000 population
Excessive Drinking
33
19.5 % of adults
Obesity
34
31.7 % of adults
Physical Inactivity
33
24.9 % of adults
Smoking
43
22.1 % of adults
Community
& Environment
35
Air Pollution
33
8.3 micrograms per cubic meter
Children in Poverty
30
18.6 % of children
Infectious Disease
22
-.167 mean z score
Occupational Fatalities
29
4.8 deaths per 100,000
Violent Crime
43
519 offenses per 100,000
Policy
42
Immunizations - Adolescents
45
-1.133 mean z score
Immunizations - Children
43
66.9 of children 19-35 months
Public Health Funding
45
$53 per person
Uninsured
31
9.4 % of population
Clinical
Care
41
Dentists
41
48.5 per 100,000
Low Birthweight
29
8.3 % of live births
Mental Health Providers
36
171.5 per 100,000
Preventable Hospitalizations
40
56.6 discharges per 1,000 Medicare enrollees
Primary Care Physicians
16
160.4 per 100,000
Health
Outcomes
40
Cancer Deaths
41
209 per 100,000
Cardiovascular Deaths
41
288.6 per 100,000
Diabetes
37
11.5 % of adults
Infant Mortality
30
6.3 deaths per 1,000 live births
Premature Deaths
40
8,558 years lost before age 75 per 100,000

Behaviors
26
Drug Deaths
19
14 per 100,000 population
Excessive Drinking
12
16.7 % of adults
Obesity
35
31.8 % of adults
Physical Inactivity
26
23.3 % of adults
Smoking
28
17.9 % of adults
Community
& Environment
31
Air Pollution
25
7.8 micrograms per cubic meter
Children in Poverty
35
19.3 % of children
Infectious Disease
48
.830 mean z score
Occupational Fatalities
10
3.9 deaths per 100,000
Violent Crime
26
372 offenses per 100,000
Policy
30
Immunizations - Adolescents
31
-.217 mean z score
Immunizations - Children
6
77.8 of children 19-35 months
Public Health Funding
42
$56 per person
Uninsured
41
10.8 % of population
Clinical
Care
31
Dentists
36
51.2 per 100,000
Low Birthweight
41
9.1 % of live births
Mental Health Providers
24
219.1 per 100,000
Preventable Hospitalizations
26
49 discharges per 1,000 Medicare enrollees
Primary Care Physicians
34
130.9 per 100,000
Health
Outcomes
33
Cancer Deaths
32
196.9 per 100,000
Cardiovascular Deaths
30
254.3 per 100,000
Diabetes
35
11.3 % of adults
Infant Mortality
42
7.2 deaths per 1,000 live births
Premature Deaths
33
7,889 years lost before age 75 per 100,000

Behaviors
37
Drug Deaths
41
20.3 per 100,000 population
Excessive Drinking
2
12.8 % of adults
Obesity
42
32.8 % of adults
Physical Inactivity
41
28.5 % of adults
Smoking
36
19.6 % of adults
Community
& Environment
41
Air Pollution
30
8.1 micrograms per cubic meter
Children in Poverty
41
21.7 % of children
Infectious Disease
38
.280 mean z score
Occupational Fatalities
47
8.1 deaths per 100,000
Violent Crime
37
450 offenses per 100,000
Policy
49
Immunizations - Adolescents
34
-.323 mean z score
Immunizations - Children
42
67 of children 19-35 months
Public Health Funding
25
$87 per person
Uninsured
48
13.9 % of population
Clinical
Care
43
Dentists
39
49.6 per 100,000
Low Birthweight
22
7.9% of live births
Mental Health Providers
5
382.7 per 100,000
Preventable Hospitalizations
44
59.9 discharges per 1,000 Medicare enrollees
Primary Care Physicians
35
127.5 per 100,000
Health
Outcomes
43
Cancer Deaths
45
216.9 per 100,000
Cardiovascular Deaths
48
335.2 per 100,000
Diabetes
41
12 % of adults
Infant Mortality
47
7.7 deaths per 1,000 live births
Premature Deaths
44
9,951 years lost before age 75 per 100,000

Behaviors
42
Drug Deaths
23
14.5 per 100,000 population
Excessive Drinking
25
18.5 % of adults
Obesity
39
32.3 % of adults
Physical Inactivity
39
26.1% of adults
Smoking
39
20 % of adults
Community
& Environment
46
Air Pollution
25
7.8 micrograms per cubic meter
Children in Poverty
44
22.6 % of children
Infectious Disease
47
.793 mean z score
Occupational Fatalities
42
6.4 deaths per 100,000
Violent Crime
41
502 offenses per 100,000
Policy
44
Immunizations - Adolescents
49
-1.633 mean z score
Immunizations - Children
32
69.7 of children 19-35 months
Public Health Funding
32
$74 per person
Uninsured
39
10.5 % of population
Clinical
Care
46
Dentists
42
48.2 per 100,000
Low Birthweight
45
9.5 % of live births
Mental Health Providers
39
157.7 per 100,000
Preventable Hospitalizations
18
45.6 discharges per 1,000 Medicare enrollees
Primary Care Physicians
36
127 per 100,000
Health
Outcomes
44
Cancer Deaths
37
201.3 per 100,000
Cardiovascular Deaths
36
277 per 100,000
Diabetes
45
13 % of adults
Infant Mortality
36
6.7 deaths per 1,000 live births
Premature Deaths
42
9,131 years lost before age 75 per 100,000

Behaviors
43
Drug Deaths
39
19.9 per 100,000 population
Excessive Drinking
6
14.4 % of adults
Obesity
45
34.8 % of adults
Physical Inactivity
40
28.4 % of adults
Smoking
43
22.1 % of adults
Community
& Environment
40
Air Pollution
32
8.2 micrograms per cubic meter
Children in Poverty
42
21.9 % of children
Infectious Disease
15
-.380 mean z score
Occupational Fatalities
33
5.1 deaths per 100,000
Violent Crime
47
633 offenses per 100,000
Policy
35
Immunizations - Adolescents
47
-.373 mean z score
Immunizations - Children
40
67.4 of children 19-35 months
Public Health Funding
23
$94 per person
Uninsured
34
9.7 % of population
Clinical
Care
45
Dentists
40
49.2 per 100,000
Low Birthweight
41
9.1 % of live births
Mental Health Providers
43
138.2 per 100,000
Preventable Hospitalizations
43
59.3 discharges per 1,000 Medicare enrollees
Primary Care Physicians
27
138.5 per 100,000
Health
Outcomes
45
Cancer Deaths
44
216.5 per 100,000
Cardiovascular Deaths
45
308 per 100,000
Diabetes
44
12.7 % of adults
Infant Mortality
38
6.9 deaths per 1,000 live births
Premature Deaths
43
9,467 years lost before age 75 per 100,000

Behaviors
15
Drug Deaths
5
9.7 per 100,000 population
Excessive Drinking
32
19.4 % of adults
Obesity
43
33.6 % of adults
Physical Inactivity
34
25.2 % of adults
Smoking
10
14.3 % of adults
Community
& Environment
37
Air Pollution
39
8.9 micrograms per cubic meter
Children in Poverty
34
19.2 % of children
Infectious Disease
36
.277 mean z score
Occupational Fatalities
38
5.6 deaths per 100,000
Violent Crime
34
434 offenses per 100,000
Policy
50
Immunizations - Adolescents
39
-.493 mean z score
Immunizations - Children
33
69.5 of children 19-35 months
Public Health Funding
38
$67 per person
Uninsured
50
16.9 % of population
Clinical
Care
38
Dentists
30
52.3 per 100,000
Low Birthweight
28
8.2 % of live births
Mental Health Providers
49
98.3 per 100,000
Preventable Hospitalizations
34
53.2 discharges per 1,000 Medicare enrollees
Primary Care Physicians
45
112.9 per 100,000
Health
Outcomes
34
Cancer Deaths
11
180.9 per 100,000
Cardiovascular Deaths
34
261.1 per 100,000
Diabetes
33
11.2 % of adults
Infant Mortality
23
5.8 deaths per 1,000 live births
Premature Deaths
23
7,175 years lost before age 75 per 100,000

Behaviors
8
Drug Deaths
7
11.3 per 100,000 population
Excessive Drinking
15
17.4 % of adults
Obesity
21
29 % of adults
Physical Inactivity
26
23.3 % of adults
Smoking
15
15.3 % of adults
Community
& Environment
6
Air Pollution
20
7.5 micrograms per cubic meter
Children in Poverty
11
13 % of children
Infectious Disease
13
-.443 mean z score
Occupational Fatalities
20
4.2 deaths per 100,000
Violent Crime
4
218 offenses per 100,000
Policy
39
Immunizations - Adolescents
40
-.590 mean z score
Immunizations - Children
45
65.9 of children 19-35 months
Public Health Funding
33
$73 per person
Uninsured
28
8.9 % of population
Clinical
Care
19
Dentists
14
63.6 per 100,000
Low Birthweight
22
7.9 % of live births
Mental Health Providers
40
145.2 per 100,000
Preventable Hospitalizations
15
42.8 discharges per 1,000 Medicare enrollees
Primary Care Physicians
24
141.8 per 100,000
Health
Outcomes
19
Cancer Deaths
24
190.1 per 100,000
Cardiovascular Deaths
25
239.1 per 100,000
Diabetes
23
10.4 % of adults
Infant Mortality
23
5.8 deaths per 1,000 live births
Premature Deaths
19
6,696 years lost before age 75 per 100,000

Behaviors
48
Drug Deaths
50
35.3 per 100,000 population
Excessive Drinking
1
11.8 % of adults
Obesity
50
37.7 % of adults
Physical Inactivity
41
28.5 % of adults
Smoking
50
24.8 % of adults
Community
& Environment
36
Air Pollution
24
7.7 micrograms per cubic meter
Children in Poverty
48
27.3 % of children
Infectious Disease
1
-1.107 mean z score
Occupational Fatalities
46
7.7 deaths per 100,000
Violent Crime
24
358 offenses per 100,000
Policy
12
Immunizations - Adolescents
17
.283 mean z score
Immunizations - Children
47
64.7 of children 19-35 months
Public Health Funding
1
$296 per person
Uninsured
10
5.7 % of population
Clinical
Care
44
Dentists
44
47.9 per 100,000
Low Birthweight
45
9.5 % of live births
Mental Health Providers
48
112.7 per 100,000
Preventable Hospitalizations
49
75 discharges per 1,000 Medicare enrollees
Primary Care Physicians
17
159.6 per 100,000
Health
Outcomes
46
Cancer Deaths
49
226.9 per 100,000
Cardiovascular Deaths
43
295.5 per 100,000
Diabetes
50
15 % of adults
Infant Mortality
41
7.1 deaths per 1,000 live births
Premature Deaths
49
10,478 years lost before age 75 per 100,000
(2017). Assets.americashealthrankings.org. Retrieved 27 December 2017, from https://assets.americashealthrankings.org/app/uploads/2017annualreport.pdf
Elizabeth Cohen, S. (2017). America's healthiest and least healthy states. CNN. Retrieved 27 December 2017, from http://www.cnn.com/2017/12/12/health/2017-health-disparities-report/index.html